Introduction: What is IOFS?
Motivation
It is very hard to analyze I/O requests and their performance as there are many parameters that determine request time, like
- Page alignment
- VFS scheduling
- Process scheduling and priority
- Network congestion
- Running programs
- File system configuration
and many more. Normal analysis tools often need sophisticated knowledge, elevated access and/or custom code adjustments.
For example, here is an overview of Linux highly complex I/O architecture:
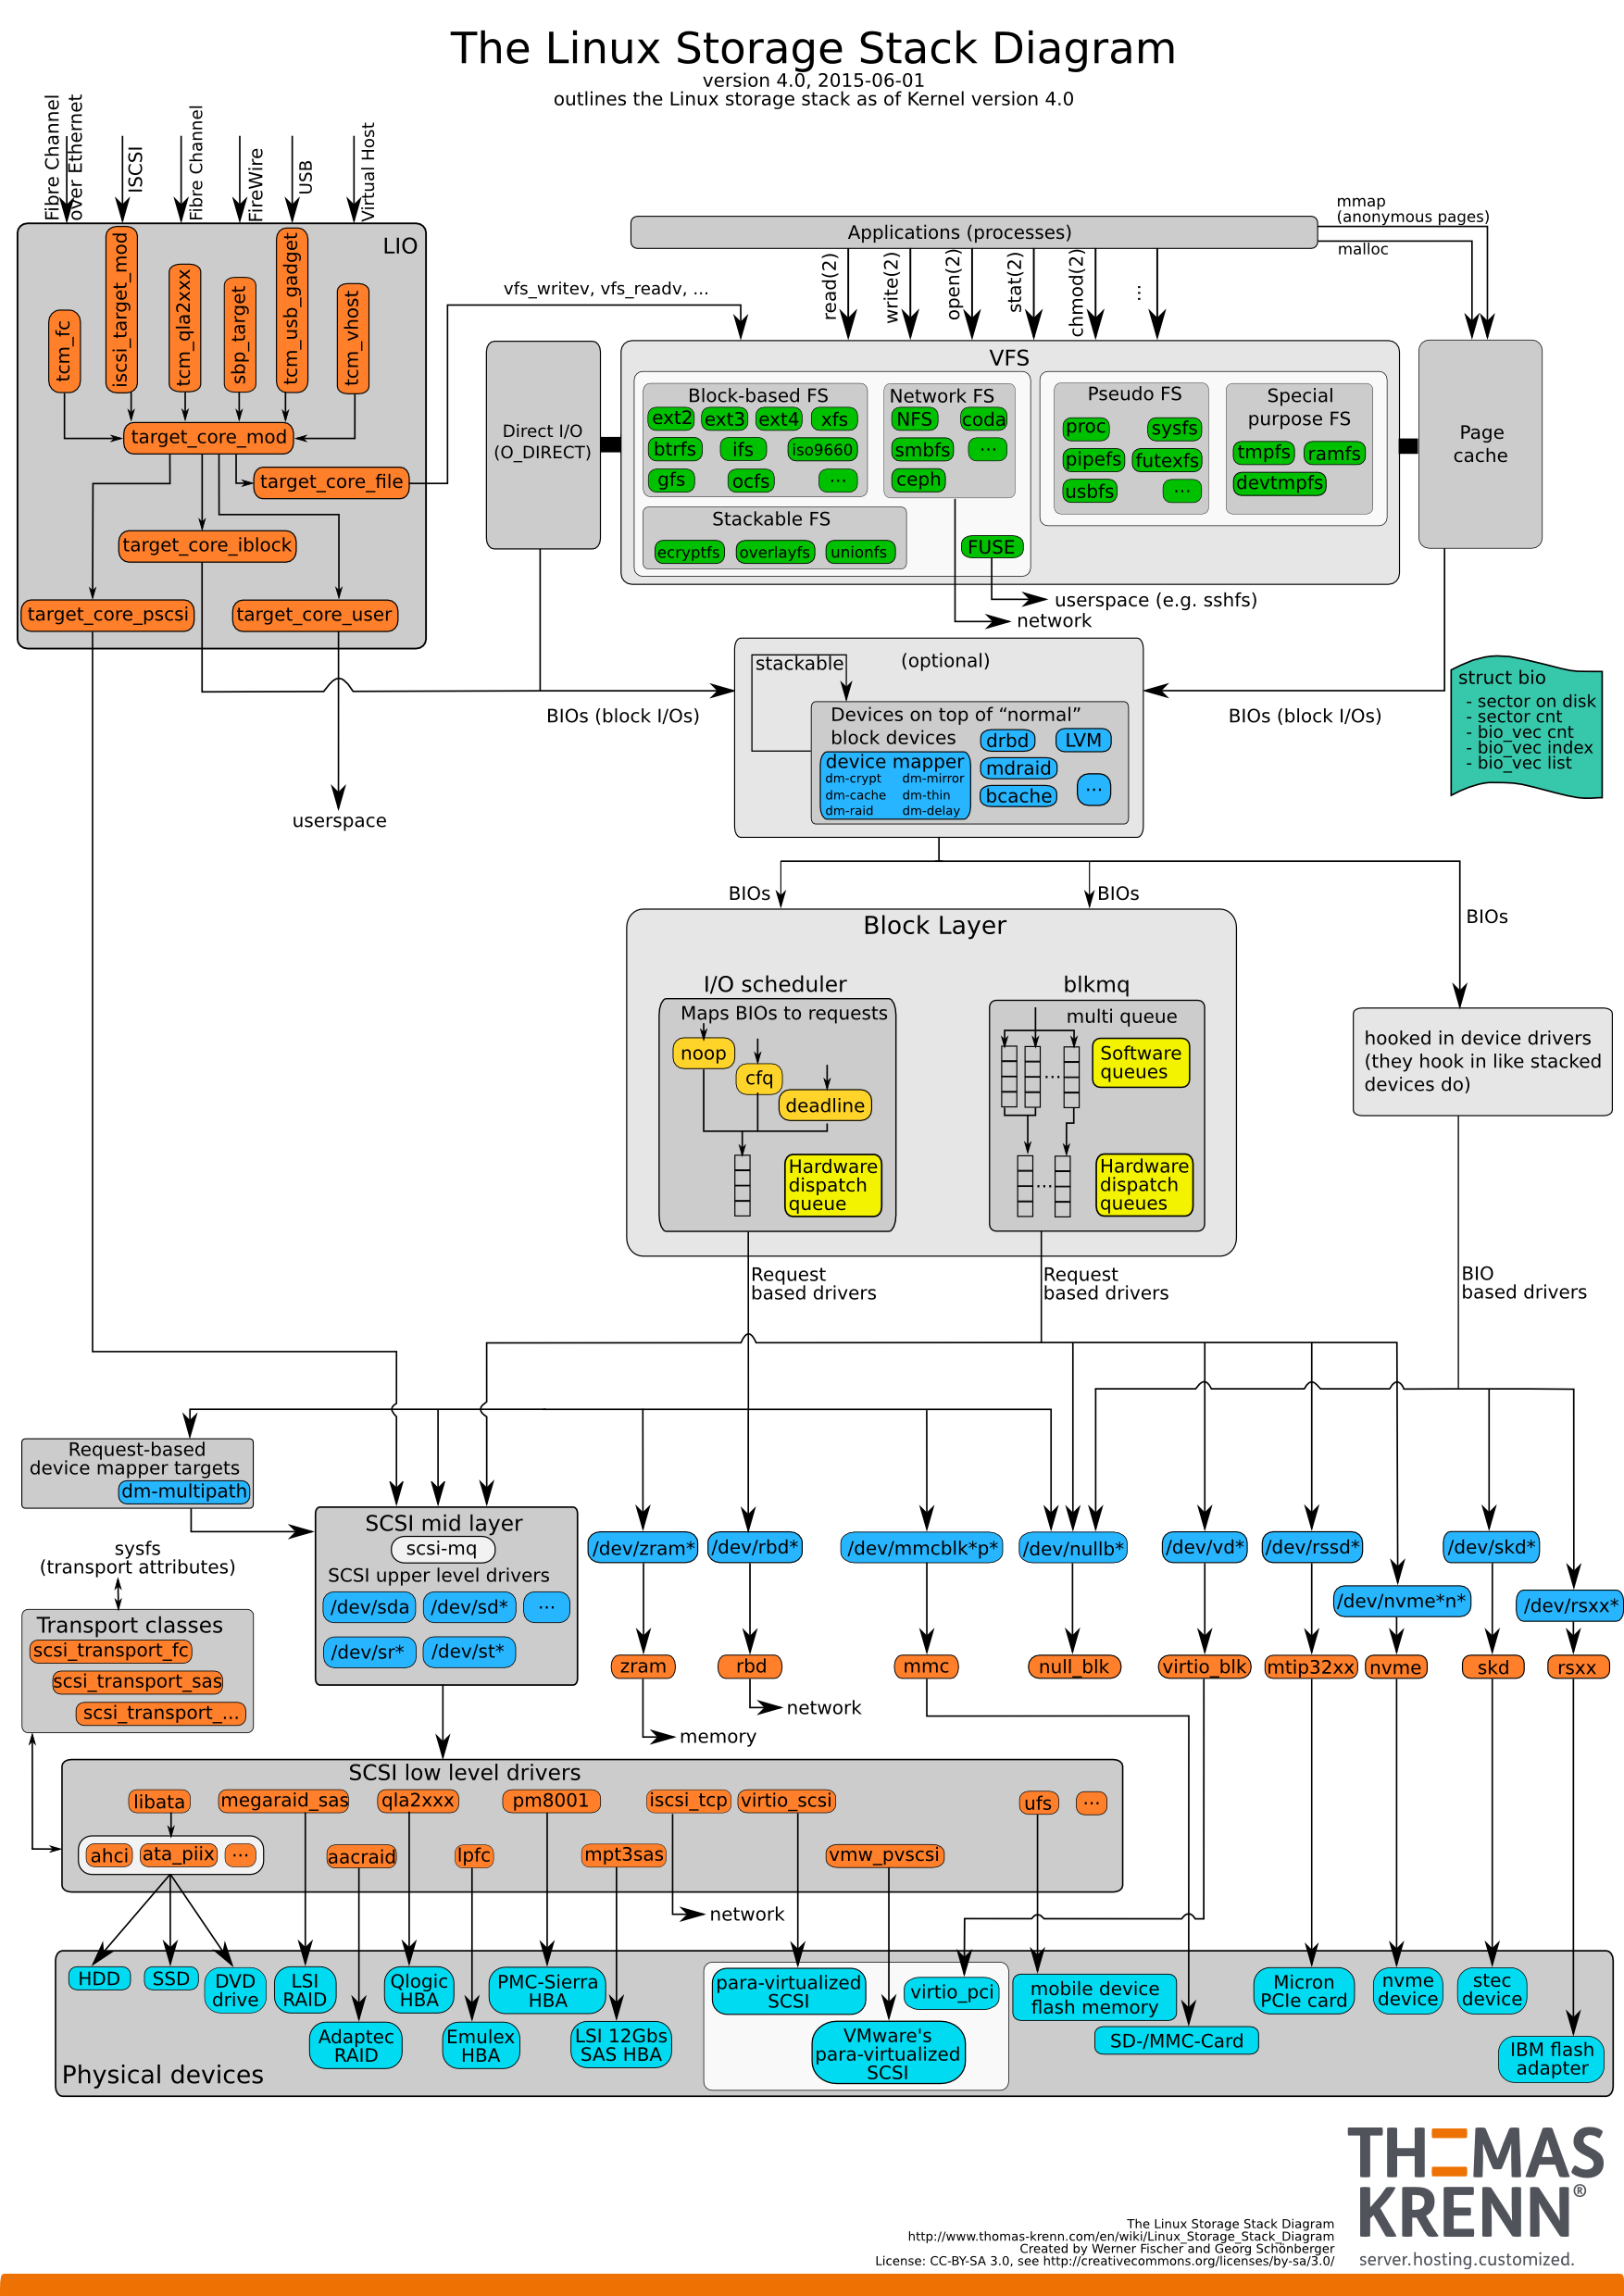
This results in most programmers, especially interdisciplinary researchers, not being able to sufficiently optimize their I/O accesses. We try to solve this problem with a pure blackbox approach.
Our goals with our solution are the following:
- Give all HPC users a tool to monitor and rudimentary analyze their I/O
- Require no code changes, no specific compiler, no specific linking
- Easy to set up, no propriatary software or specfic knowledge required
- Completely run in user space, no administration required
- Integrate in common tooling for further analysis
- Require no assumptions about the underlying server topology
Our Approach
As mentioned above, we developed iofs as a blackbox approach to report and, together with blackheap, classify all I/O requests without requiring any further information about the I/O hardware or software configuration.
FUSE
We use the Linux userspace filesystem framework FUSE (Filesystem in Userspace) in order to intercept all I/O requests. FUSE works as follows:

FUSE consists of two parts: The FUSE kernel module and the libfuse library to build file systems. We use FUSE to insert our monitoring logic.
Grafana / Elasticsearch / InfluxDB
In order to allow for easier aggregated analysis of multiple clusters, we support data streaming.
Our inhouse data monitoring setup is set up as follows:
Monitoring
Although we use Grafana as our monitoring platform, iofs is platform agnostic, as it directly inserts the data into the underlying database.
Database
We use the InfluxDB TSDB (Time Series DataBase) as our data source for Grafana. iofs currently only supports the InfluxQL API, not the Flux Syntax. Furthermore, iofs is only tested for InfluxDB 1.x.
We also have some streaming logic to support Elasticsearch as a TSDB, although this is not tested nor actively maintained.
How it works
In order to track and monitor the I/O requests, the user is required to "proxy" all requests through our pseudo-filesystem. Once this is done, the high level workflow works as follows:
- User does a request on our pseudo filesystem
- The request goes to the Linux VFS
- The Linux VFS sees that this is a FUSE filesystem and lets the FUSE kernel module manage the request
- The FUSE kernel module calls the appropriate
iofsmethod for the requested operation. iofsextracts all request informations.- Then it maps the path to the real path
- Does the underlying file system operation
- Tracks how long the request takes
- Aggregates all measured data into some global data structure
- returns the result of the underlying operation
- The result gets passed to the FUSE kernel module, then gets passed to the VFS module, then gets passed to the caller.
Every time interval, all aggregated metrics get streamed to any of the two TSDB supported. Note that this is non-blocking.
Quickstart
This short guide will show you how to install iofs and use it
- locally in standalone mode or
- with a Grafana/InfluxDB docker compose setup
Installation
Dependencies
The following dependencies are required:
libcurlfuse3libfuse3-dev
Build Process
The build process is pretty straight forward
mkdir build && cd build
cmake ..
make
The binary can now be found at ./build/src/iofs. In order to automatically install it, use
make install
Further options
You can set the install path with
cmake --install-prefix=/opt/iofs/
To set the default path for the iofs config file, use
cmake --DCONFIG_PATH=/opt/iofs/etc/iofs.conf ..
How to Use (In standalone mode)
Once compiled, iofs can be executed via
iofs <absolute_path_target> <absolute_path_source>
Example: If you have your real data on /data/my-data, and want to measue it by accessing /opt/iofs-data, you'd use
iofs /opt/iofs-data /data/my-data
Further Configuration
All possible configuration settings can be seen via iofs --help or in the example configuration.
Everything except the mount points can be both configured via CLI parameters or config file. Note that the CLI parameters have a higher precedence.
There are 2 ways to use a configuration file:
- Define the configuration file path at compile time.
- Set the
IOFS_CONFIG_PATHenvironment variable to the proper path, i.e.
IOFS_CONFIG_PATH=/home/user/example.conf iofs /opt/iofs-data /data/my-data
See here for a documented example.
Local Grafana Setup with Docker
Link to Docker Files
How to start
- Fill out the
.envfile - Start the
dockerwithdocker compose up - (Optional): Add some dummy data to find out whether it actually works
- Next, we have to define
influxdbas the data source in grafana. See below. - If not done previously, we have to enable
user_allow_otherin the/etc/fuse.conf - Lastly, we have to compile
iofs(see rootsREADME.md) and run it via
./iofs <PATH_TO_WHERE_YOU_WRITE> <PATH_ON_WHAT_YOU_MAP> --in-server=http://localhost:8086 --in-db=mydb --in-username=influx --in-password=influxdblongpassword123
If you changed the parameters in .env, change then here accordingly.
Now you can create your first dashboard!
(Optional): Add some dummy data
Update: This is also automated using the fill_influx.py script in the docker-devenv folder
This is optional, but recommended for the following reason: If you have an empty InfluxDB, Grafana can't verify whether the connection actually works. If you configure the data source correct, you can see the 200 returned by InfluxDB in your docker logs. But since the returned JSON contains no data, Grafana interprets it as a failed fetch, thus showing a false error. So, even if optional, this will make your debugging a lot easier.
- Start the docker-container (check with
docker container lsafterwards). - Get a shell into the influxdb container. By default, the container is named
influxc:
docker exec -it influxc bash
- Now manually connect to the influxdb-cli. Use credentials according to the
.envfile.
influx -username influx -password influxdblongpassword123 -precision rfc3339
The precision defines the date format and rfc3339 is used everywhere in the documentation
4. Once in the influxdb shell, use the database specified in the .env file.
USE mydb;
The database name should match the name specified in the .env. For created all databases, see
SHOW DATABASES;
- Create some dummy data. Here the related docs.
INSERT treasures,captain_id=pirate_king value=2
Note that the semicolon is missing ;)
Add the (already initialized) influxdb to grafana
- Start the docker-container (check with
docker container lsafterwards). - Connect to grafana via http://localhost:3000/
- Login with the credentials set in
.env(grafana:grafanais default) - Go to
Connections->Data Sources->Add Data Source->InfluxDB - Add the following configuration:
Query Language: Since we explicitly use influxdb version 1, we have to use InfluxQL.
URL: Since we use docker compose (instead of the default network bridge) container name DNS is enabled. Thus we can use http://influxc:8086.
InfluxDB Details: Use the Database, User, Password specified in the .env
- Afterwards test the configuration via
Save & test. If everything was configured successfully, it should show an alert withData source is working. If you have thedocker-composelogs open, you should see a request with aGrafana/x.x.xuser agent as well.
Workflows
Workflow Overview
Here are some Graph representations of the workflows.
Firstly, the overall overview:

Secondly, the reporting thread internals:

More In-Depth Overview
This section will be split into three parts:
- How does the program get initialized?
- What happens if someone does a I/O request of any kind?
- How is the data getting streamed into a TSDB?
How does the program get initialized?
At first, the main parses all arguments given via cli arguments or configuration file, with the cli having higher precedence. Afterwards, it starts the fuse_main().
The fuse_main() is configured by a so-called fuse_operations struct. This struct has a bunch of function pointers, which represent the functions required to be implemented by an FUSE filesystem (some are optional). It additionally defines some other functions, like a init and destroy function for starting and stopping the file system.
So, in order to initialize the FUSE file system, the fuse_main() calls our cache_init(), which is just a wrapper around our real monitor_init().
The monitor_init() initializes all aggregation data structures as well as cURL for the REST data transfer. After that, it starts the reporting_thread() as a seperate pthread, which runs until the filesystem destroys itself via cache_destroy().
What happens if someone does a I/O request of any kind?
We already gave a higher level overview in the introduction. But it works as follows:
At first, the user/caller calls any usual I/O function provided by the Linux kernel. This gets processed by the Linux VFS, which matches the proper kernel module for the file system. In our case, this is the FUSE kernel module.
The FUSE kernel module then calls the approprivate function given by our fuse_operations struct. All our functions have the cache_ prefix, thus calling the X function would end in cache_X(). This is only our personal convention.
After cache_X is called, we get the fake path prefix, which we have to map to where the file actually exists.
For example: We mounted /data/real-data to /opt/fuse-playground. Thus we get an I/O request for /opt/fuse-playground/some-path/data.dat, which we internally have to map to /data/real-data/some-path/data.dat.
After that is done, we can just call the same function X for our new path. This again gets passed through the VFS, but this time gets processed by the real file system kernel module.
When arriving the result, we track how long it took, and save the recorded data in our global structs. More on those in the next part. Lastly, we just return the same information we got back to the caller.
How is the data getting streamed into a TSDB?
This is done by the aforementioned reporting_thread() method. This function runs in a endless loop until some state gets toggled by the cache_destroy() which is used to cleanup a filesystem before shutting down.
Every interval, which is chosen by the user, the function sends all aggregated data to the sources configured by the user.
This is pretty straightforward and the code is easily readable, as we just format and send our data in such a way to comply with Influx.
But one thing is still worth mentioning: How the data formatting and transfer is done non-blockingly without producing strongly inaccurate data.
This is done by having the global state two times. In essence, it works as follows:
- State 1 is ready to be sent
- Tell the program to send all data to state 2
- Process state 1, send it, wait until the interval is done
- Switch back to state 1 and process state 2
More ressources
We first published a talk about iofs at the HPC-IODC workshop at the ISC 2022.
Here are our slides: